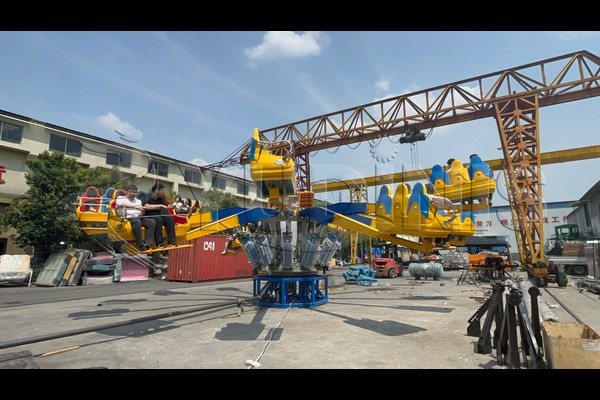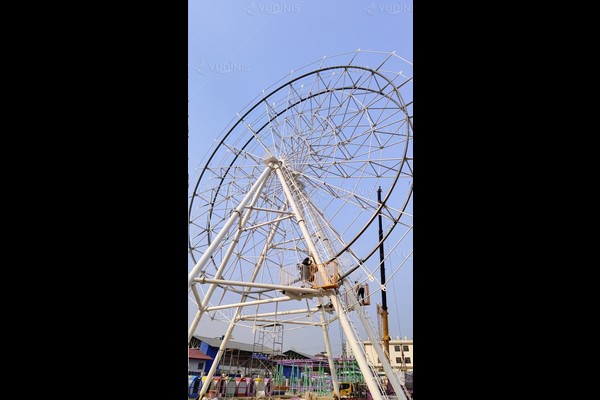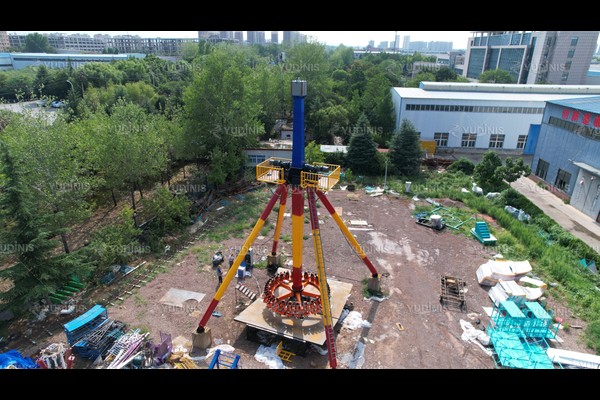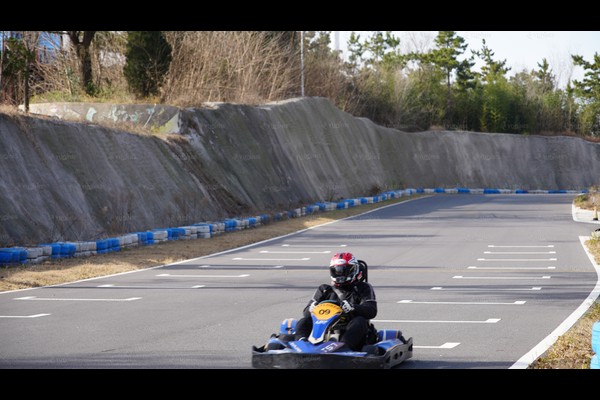
Two parks can own the same ride and earn very different amounts from it, because throughput is created by operations rather than by the manufacturer.
This is how to work out what a ride really delivers per hour, and how to fix the losses that cost the most.
Key Specifications
| Item | Reference |
|---|---|
| Throughput | Riders per hour per ride |
| Cycle time | Ride time plus loading and unloading |
| Main bottleneck | Loading discipline, not the machine |
| Queue design | Sub queues and group filling |
| Peak planning | Weekend and holiday profiles |
| Measurement | Log cycles per operating day |
All figures are reference values and are confirmed in the engineering proposal for your site.
Calculating Real Throughput
Start with riders per cycle, multiply by cycles per hour, then subtract the losses you actually observe. Cycle time includes loading, restraint checking, the ride itself and unloading, and it is usually longer than the brochure figure. Time the process for twenty consecutive cycles at peak hours, and the difference between the theoretical and actual number tells you where to focus.
Where Throughput Is Lost
The biggest losses are load discipline, batching and baggage handling. Guests who reach the platform before the previous group has cleared delay every cycle, and loose bags left on the platform add minutes per hour. Assign one operator to batching at the gate and one to restraints, define a clear hand signal to the control cabin, and the same machine will deliver noticeably more riders per hour.
Queue Design That Earns
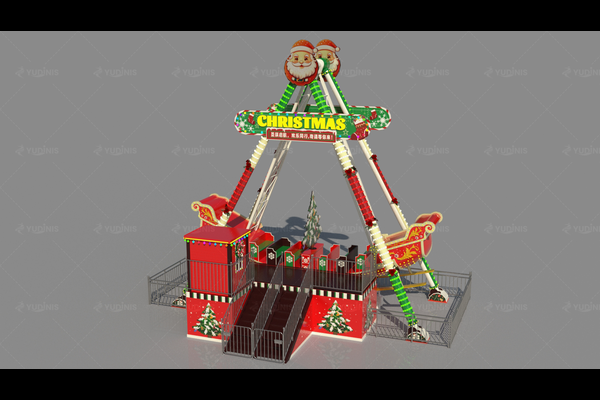
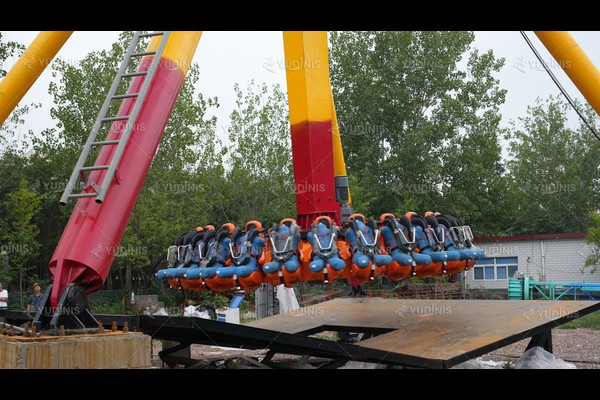
Queues are not dead space. A queue that passes a photo point, a drinks cooler or an upsell window turns waiting time into revenue, and a single-rider lane fills empty seats that would otherwise ride empty. Keep the queue inside shade, show an honest waiting time at the entrance, and make sure the exit route does not cross the entry – the same discipline used on high capacity machines such as our 36 seats swing chair ride.
Measuring, Then Improving
Log cycles per day for every ride and review the data weekly – this is the simplest form of queueing theory applied to a park. When one ride consistently under performs, the cause is usually staffing or procedure rather than equipment, and it can be corrected without capital spending. Publish the improvement internally, because operators improve fastest when they can see their own numbers.
Design Options
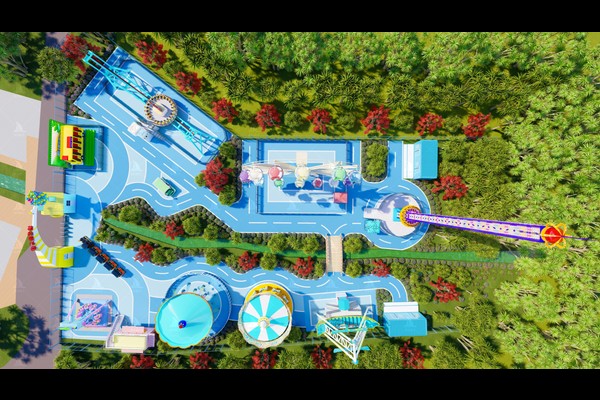
Site-specific choices include: Ride mix, queue layout and operating procedures.
We quote as the direct equipment manufacturer from a 125,000 m² production base, so the technical conversation and the commercial one happen in the same place, with 20 years of export projects behind the answer. Project work includes layout drawings, phased equipment lists and documentation you can hand straight to a local contractor.
Give us the site details and the deadline you are working to – we will map the phases, the equipment and the cost outline against it.